Monitoring
In monitoring, we map strategically important key figures, which we call KPIs (Key Performance Indicators) below.
Four data series (Plan (Budget), Target, Actual and Forecast) and three time frames (month, quarter, year) are available for each KPI. Automatic aggregation of monthly values to quarterly and annual values and automatic calculation of calculated KPIs ensure a consistent database.
A configurable traffic light system ensures that critical KPIs can be identified at a glance in deviation and change analyses or KPI cockpits and corrective measures can be initiated in line with the PDCA cycle.
KPIs can be networked with other focusMT objects and used in other modules. In this way, KPIs can be assigned to breakthrough or annual targets as a measurable success factor or processes can be assigned the relevant KPIs.
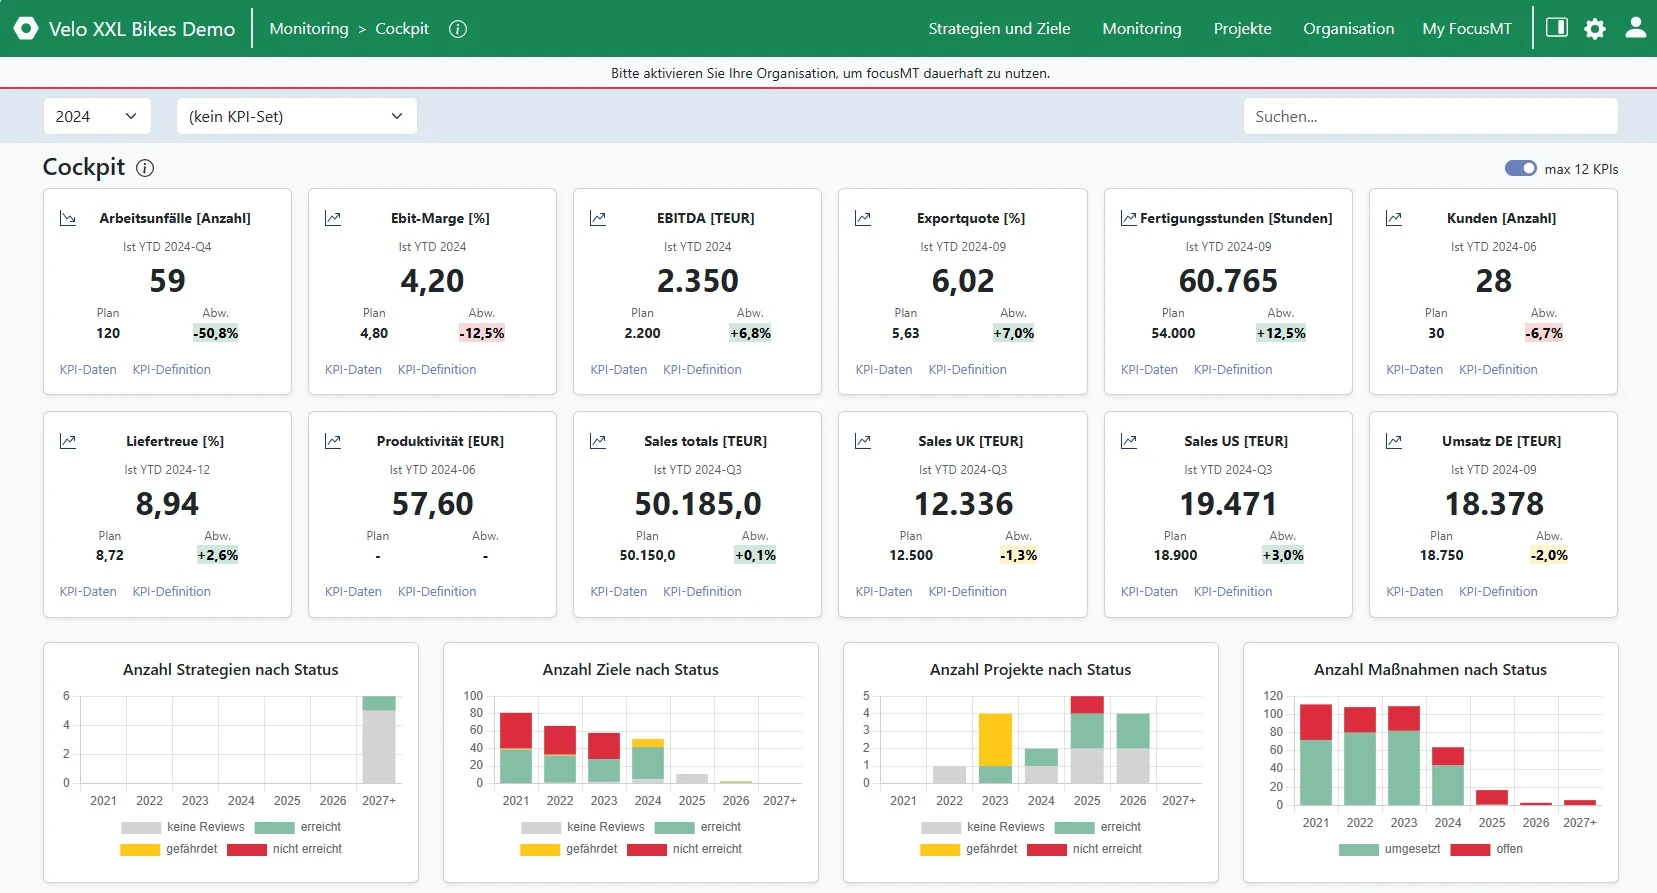
Cockpit
Navigate to Monitoring -> Cockpit via the menu.
The cockpit displays KPI cards in the upper area with the current YTD (Year To Date) values and plan/actual deviations. Hyperlinks allow you to jump from each KPI card to the detailed KPI-Data and KPI-Definition and analyze individual time periods in detail. A switch above the KPI cards allows you to set whether you want to display 6 or 12 KPIs.
Below the KPI cards, you will find four Process Diagrams that show, based on the reviews, how successful the implementation of strategies, goals, projects, and assigned measures has been in recent years.
In the Filterbar on the page, you can select the Time Period and filter by KPI Name using the quick search. In addition, you can use KPI Sets as filters, which have been created in advance according to logical criteria (e.g., sales, operations, etc.).
Display KPIs
Navigate via the menu to Monitoring -> Show KPIs.
In this screen, the KPIs are visualised in combined bar/line charts. The KPIs are selected via the structure tree on the left-hand side, in which all KPIs of the organization are displayed for which the logged-in user has write or read permissions.
When the page is called up, all KPIs that are marked as personal favourites are loaded immediately when the page is called up. This means you have your most important KPIs immediately in view.
The date filter controls the validity period of the KPIs. All KPIs that are valid in the selected period are displayed. In addition to entering an explicit start and end date, there are quick filters for selecting quarters and calendar years.
The name and unit of the KPI are displayed in the header of each KPI visual. There is also the option of marking the KPI as a personal favourite (*) so that it is displayed immediately the next time the page is opened.
In the filter bar, you can select the time grid (month, quarter, year) and the period for which values are to be displayed. By default, the time grid defined for the KPI is displayed.
Below this, you can click on the coloured markers to select which data series (target, plan, actual, forecast, benchmark) are to be displayed. This allows you to focus specifically on individual data series (e.g. plan and actual). All data series are displayed as standard.
In the column/line chart, planned, actual and forecast values are displayed as a column, target and benchmark values as a line. The axes are formatted automatically.
Below the chart, the values of the individual data series are displayed in tabular form.
Manage KPIs
Navigate via the menu to Monitoring -> Manage KPIs.
This screen displays all available KPIs as a structure tree.
The Date filter controls the validity period of the KPIs. All KPIs that are valid in the selected period are displayed. In addition to entering an explicit start and end date, there are quick filters for selecting quarters and calendar years.
The Add button can be used to add a new KPI, while Edit can be used to edit or delete an existing KPI.
The KPIs are displayed as a structure tree whose levels can be expanded and collapsed. When you click on a KPI in the structure tree, detailed information is displayed in the header on the right-hand side:
- A visual representation of the data series with their current annual values. Clicking View KPI takes you to a modal screen with the KPI values over time.
Below this, tabs show further KPI details:
- In the Description tab, the KPI can be described in detail. In addition, the aggregation method (summation, averaging, final value formation), the traffic light values and the time grids for data input and standard display are displayed.
- In the Formulas tab, the formulas for the calculation are displayed for calculated key figures.
- In the Relationships tab, relationships to other focusMT objects can be entered to make causal relationships transparent.
Create KPI
Navigate via the menu to Monitoring -> Manage KPIs and click on the Add button.
New KPIs can be added in this screen. All mandatory fields are marked with a red *.
You can use the Folder button to specify whether the new element is a folder for recording KPIs or other subfolders. If the switch is not set, a KPI is created.
A higher-level KPI can be assigned to each KPI. If you select the "None" entry, the KPI is assigned to the top level in the structure.
Each KPI requires a short and concise name. This should be formulated in such a way that it describes the KPI as accurately as possible.
A person who is responsible for recording and monitoring the KPI can be entered in the Responsible field. All persons who have been created in the focusMT module "Organization" are offered.
In the Description, the KPI can be described in more detail in the sense of a clear and precise definition so that everyone can understand what this KPI measures.
In the Validity period you can define the start and end date of the KPI. An infinite period is set by default. However, KPIs can be delimited in time if they are no longer (or not yet) valid and should disappear from the standard views. The time limit means that all existing data is retained.
In the traffic light definition, you specify when the KPI is given a red traffic light (e.g. actual / plan < 95%) or a yellow traffic light. From these two values, focusMT automatically determines the limit values for the green traffic light.
The Time dimension (input) is used to define whether the KPI values are recorded as monthly, quarterly or annual values. Monthly values are automatically aggregated to quarterly values and these are aggregated to annual values. The Time dimension (display) controls which time grid is used as the default value in all displays.
In the Unit field, select the appropriate measurement unit for the KPI from the drop-down list. If the appropriate measurement unit is missing, you can create a new one using the drop-down list.
In the Decimal places field, specify how many decimal places the KPI data should be displayed in lists and diagrams.
For deviation analyses and the cockpit, you define in the Traffic light definition field whether high or low values are good. This controls the red and green traffic light colours. Optionally, you can use a percentage value for the yellow traffic light to define when KPI data is in the yellow warning area.
Finally, you assign the appropriate Aggregation to the KPI. Here you decide whether quarterly and annual values are calculated as a total, average or final value.
In the last step, you can save your entries using the Save button and return to the KPI overview.
Edit KPI
Navigate via the menu to Monitoring -> Manage KPIs, mark the KPI to be edited in the structure and click on the Edit button.
A KPI can be edited in this modal screen. All mandatory fields are labelled with a red * in the same way as for data entry.
You can use the Save button to confirm the changes and return to KPI management.
You can delete the KPI by clicking the Delete button. For security reasons, you must confirm the deletion process by clicking the Delete button.
Manage KPI-Sets
KPIs can be grouped together under a concise title (e.g. Sales, Operations, etc.) in KPI-Sets. These sets can be used as filters in many places in focusMT to restrict the selection to these specific KPIs.
Navigate to Organisation > Manage KPI-Sets via the menu.
In this overview, all KPI sets are displayed as a tree structure.
Create KPI set Navigate to Monitoring > Manage KPI-Sets via the menu and Click on the Add button.
When adding a new KPI-Set, only a few informations are absolutely necessary. This is the name of the KPI-Set and an optional description. You can also mark a KPI set as default. This will be selected by default in selection lists.
Click on the Save button to create the KPI-Set.
Assigning KPIs KPIs can be added to a KPI-Set and deleted again if necessary. To do this, click the Add button in the KPIs tab to open a modal window where you can select all valid KPIs.
Edit a KPI-Set
- Navigate to Monitoring > Manage KPI sets via the menu.
- Click on the KPI-Set you want to edit in the structure.
- Click on the Edit button.
- Make the changes to the KPI set and then click on the Save button.
Delete KPI-Set
- Navigate to Monitoring > Manage KPI-Sets via the menu.
- Click on the KPI-Set you want to edit in the structure.
- Click on the Edit button.
- Click on the Delete button.
Entering planned values
Navigate via the menu to Monitoring -> Enter plan values.
All KPIs that are not calculated KPIs are initially displayed on an initial page. These are not displayed because the plan values are calculated for them from the "base" KPIs in the associated formula.
In the filter bar of the page, you can select the period and filter by responsible persons who were assigned in the KPI definition. You can also use a quick search to filter by description.
The columns in the list show the name, responsibility, unit, time grid and aggregation of the KPI.
Clicking on the designation takes you to the modal screen for entering the plan values.
Here you can enter the planned values for the time periods of the previously selected year. Monthly values are automatically aggregated into quarterly and annual values and quarterly values into annual values using the aggregation procedure defined for the KPI.
A distribution function of annual values to the individual time periods ensures that the values can be entered quickly and easily.
As planned values at the time of planning (usually before the start of the year) are also the best forecast values, they are adopted as forecast values, which can then be regularly adjusted in the current financial year as part of a rolling forecast. The planned values are generally no longer adjusted in the current financial year.
In the final step, you can save your entries using the Save button and return to the KPI overview.
Entering actual and forecast values
Navigate via the menu to Monitoring -> Enter actual and forecast values.
On an initial page, all KPIs that are not calculated KPIs are displayed first. These are not displayed because the actual and forecast values are calculated for them from the "base" KPIs in the associated formula.
In the filter bar of the page, you can select the period and filter by responsible persons who were assigned in the KPI definition. You can also use a quick search to filter by description.
The columns in the list show the name, responsibility, unit, time grid and aggregation of the KPI.
Clicking on the designation takes you to the modal screen for recording the actual and forecast values.
Here you can enter the actual values for the time periods of the previously selected year and also adjust the forecast for the remaining time periods of the year. Monthly values are automatically aggregated to quarterly and annual values and quarterly values to annual values using the aggregation procedure defined for the KPI.
As soon as an actual value has been entered for a time period, the forecast value for this period is deleted and the annual forecast is recalculated from the existing actual values and the forecast values for future periods (rolling forecast). The new forecast value thus provides a more reliable forecast for the year.
In the final step, you can save your entries using the Save button and return to the KPI overview.
Analyze deviations
Navigate via the menu to Monitoring -> Analyze deviations.
The deviation analysis shows the deviations actual/plan and actual/target for all KPIs at the current time (YTD) as well as the deviations forecast/plan and forecast/target in the annual forecast.
You can select the period in the filter bar on the page and filter by KPI name using the quick search function.
The Designation, Responsibility and Unit of the KPI are displayed in the first three columns of the list.
In the "Year-to-Date " area, the YTD period (most recent period with existing actual values), the cumulative actual and planned values up to this point in time and their deviation are displayed for all KPIs. The colour of the deviation results from the traffic light definition in the KPI definition. In the heading line, you can switch to target values and compare actual and target values.
The "Annual forecast " area shows the cumulative forecast and target values for all KPIs up to the end of the year as well as their deviation. The colour of the deviation results from the traffic light definition in the KPI definition. In the heading line, you can also switch to target values and compare actual and target values.
By clicking on the KPI name, you can jump to the KPI charts and analyze individual time periods in detail.
Analyze changes
navigate via the menu to Monitoring -> Analyze changes.
The change analysis shows the changes in the actual values for all KPIs compared to the previous year (YoY = Year-over-Year).
You can select the period in the filter bar on the page and filter by KPI name using the quick search function.
The Name, Responsibility and Unit of the KPI are displayed in the first three columns of the list.
The YTD period is the most recent period with existing actual values. Actual YTD (previous year) shows the cumulative actual values up to this point in the previous year, Actual YTD (current year) shows the cumulative actual values for the current year.
Year-over-Year shows how the actual values have changed compared to the previous year. Positive changes are shown in green, negative changes in red.
By clicking on the KPI name, you can jump to the KPI charts and analyze individual time periods in detail.
Tips & tricks
- Only create strategically relevant KPIs in focusMT that are important for the target agreement process or monitoring ("As few as possible, as many as necessary").
- Keep KPI data up to date and ensure that data is recorded promptly.